📈 Options: Crypto Derivatives
Research on the potential growth of options trading market. Data involved spot and perpetual market since 2017 and I've seen some incredible growth. But, options market has even more rocket potential._
✍️ edit: April 4th, 2023
🔰 credit to The Block
1️⃣ Spot Trade
Total Spot Volume
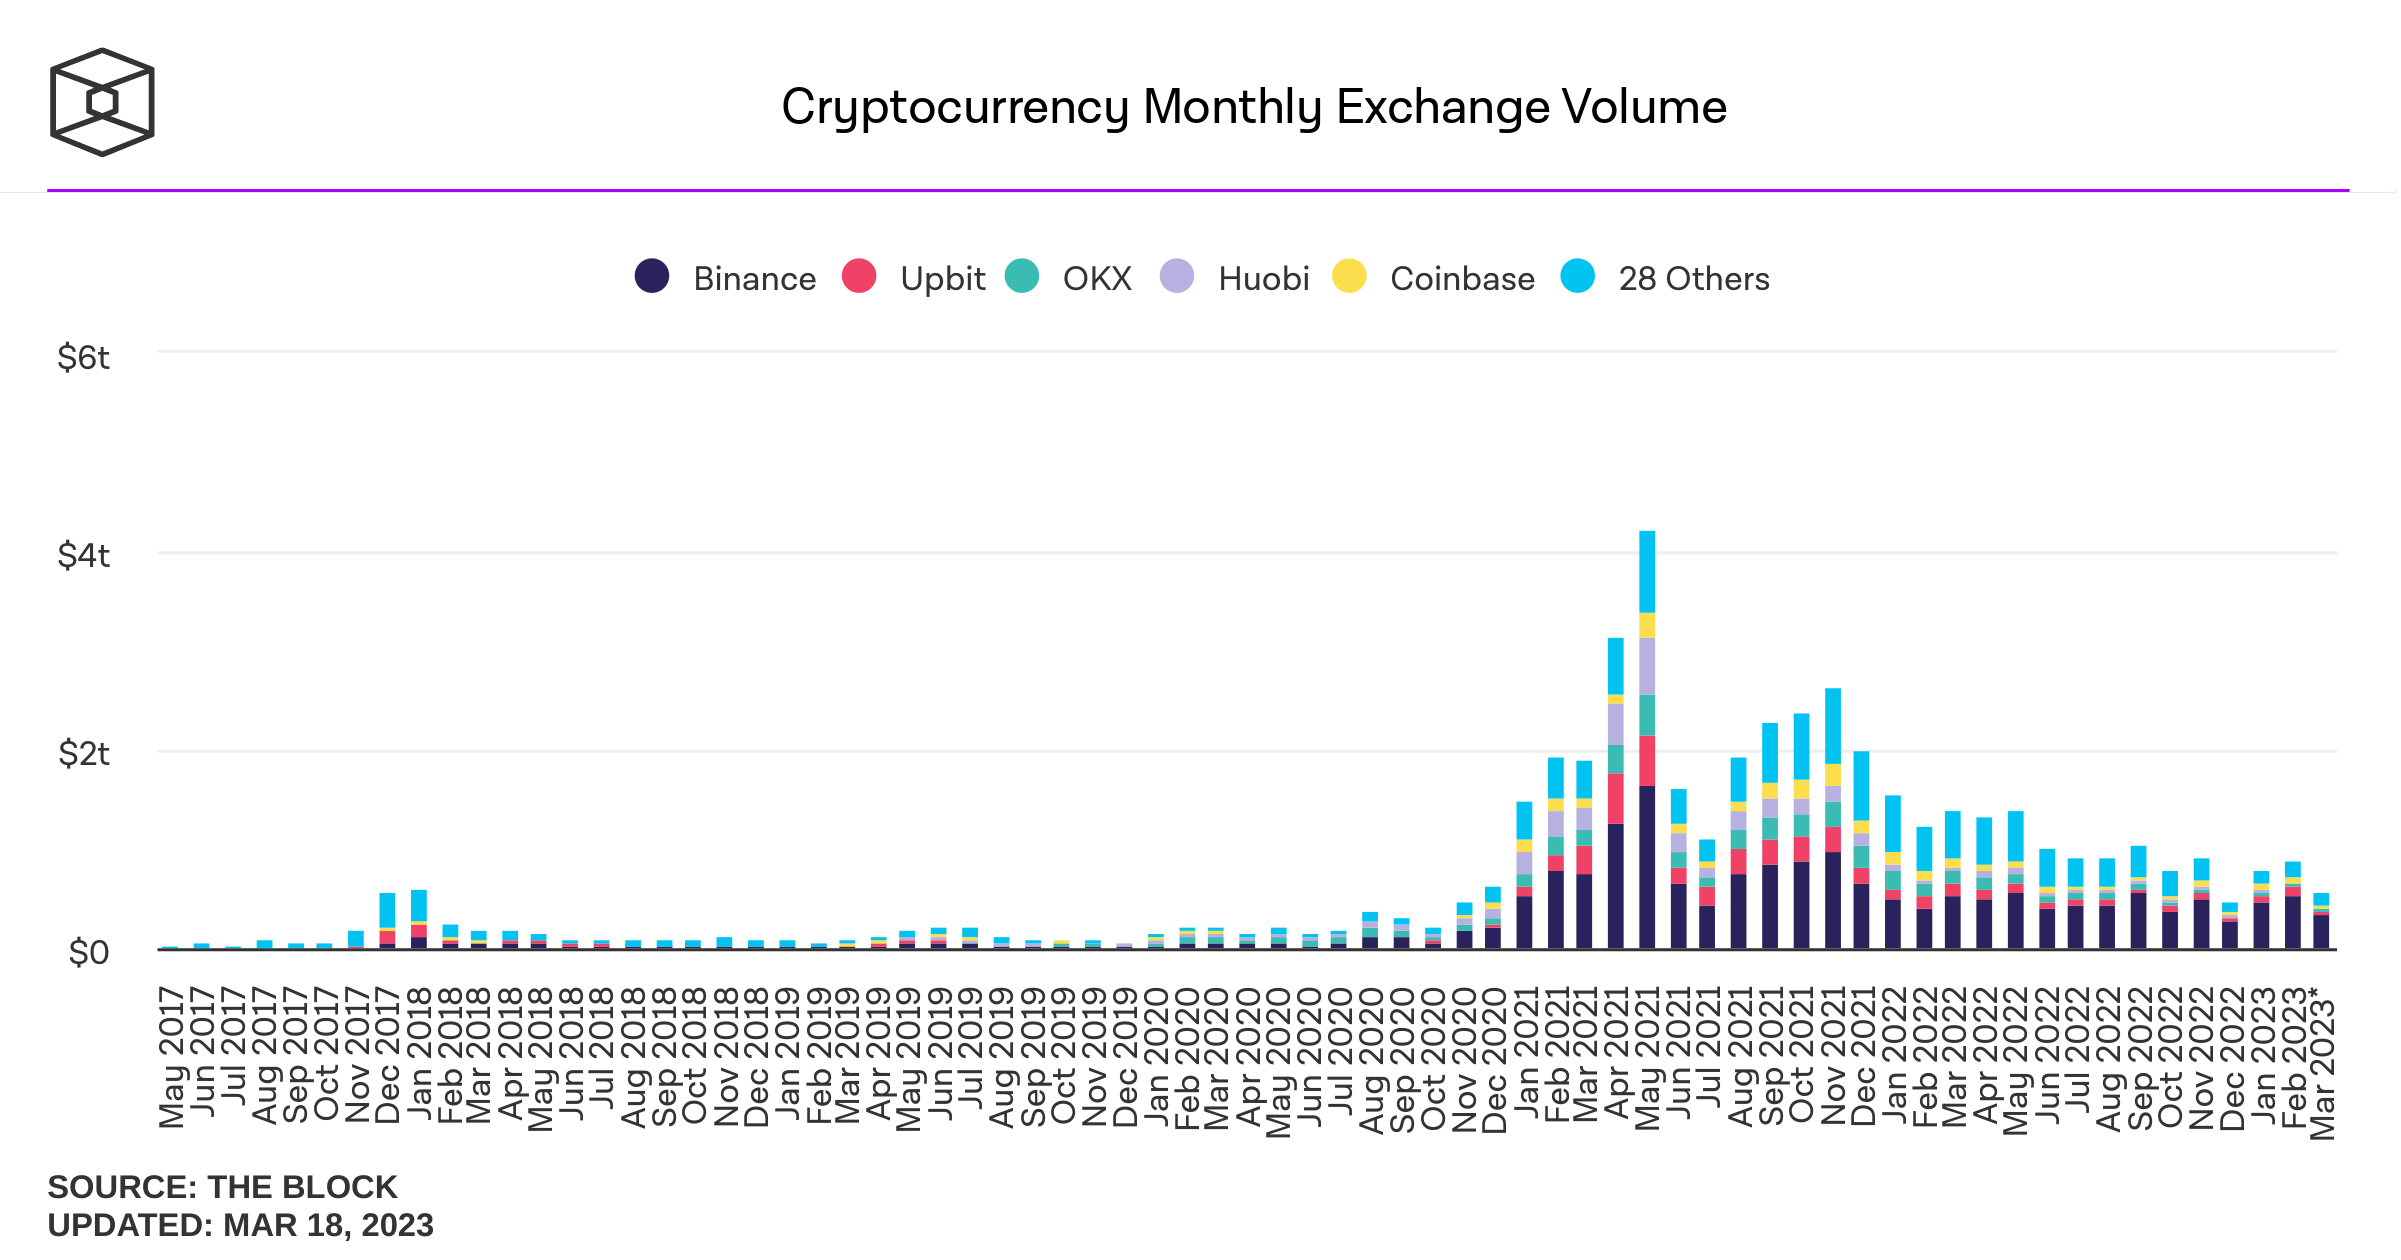
Trading volume in the spot market has increased significantly over the years! From (588B-200B) in 2017 to (4T-2T) in 2021, that's a growth rate of 680%-1000%!
🤑👉 Binance = 50% of the market share, while Upbit, Kucoin, Gate, OKX, and others also seen a significant increase in trading volume during the bull market
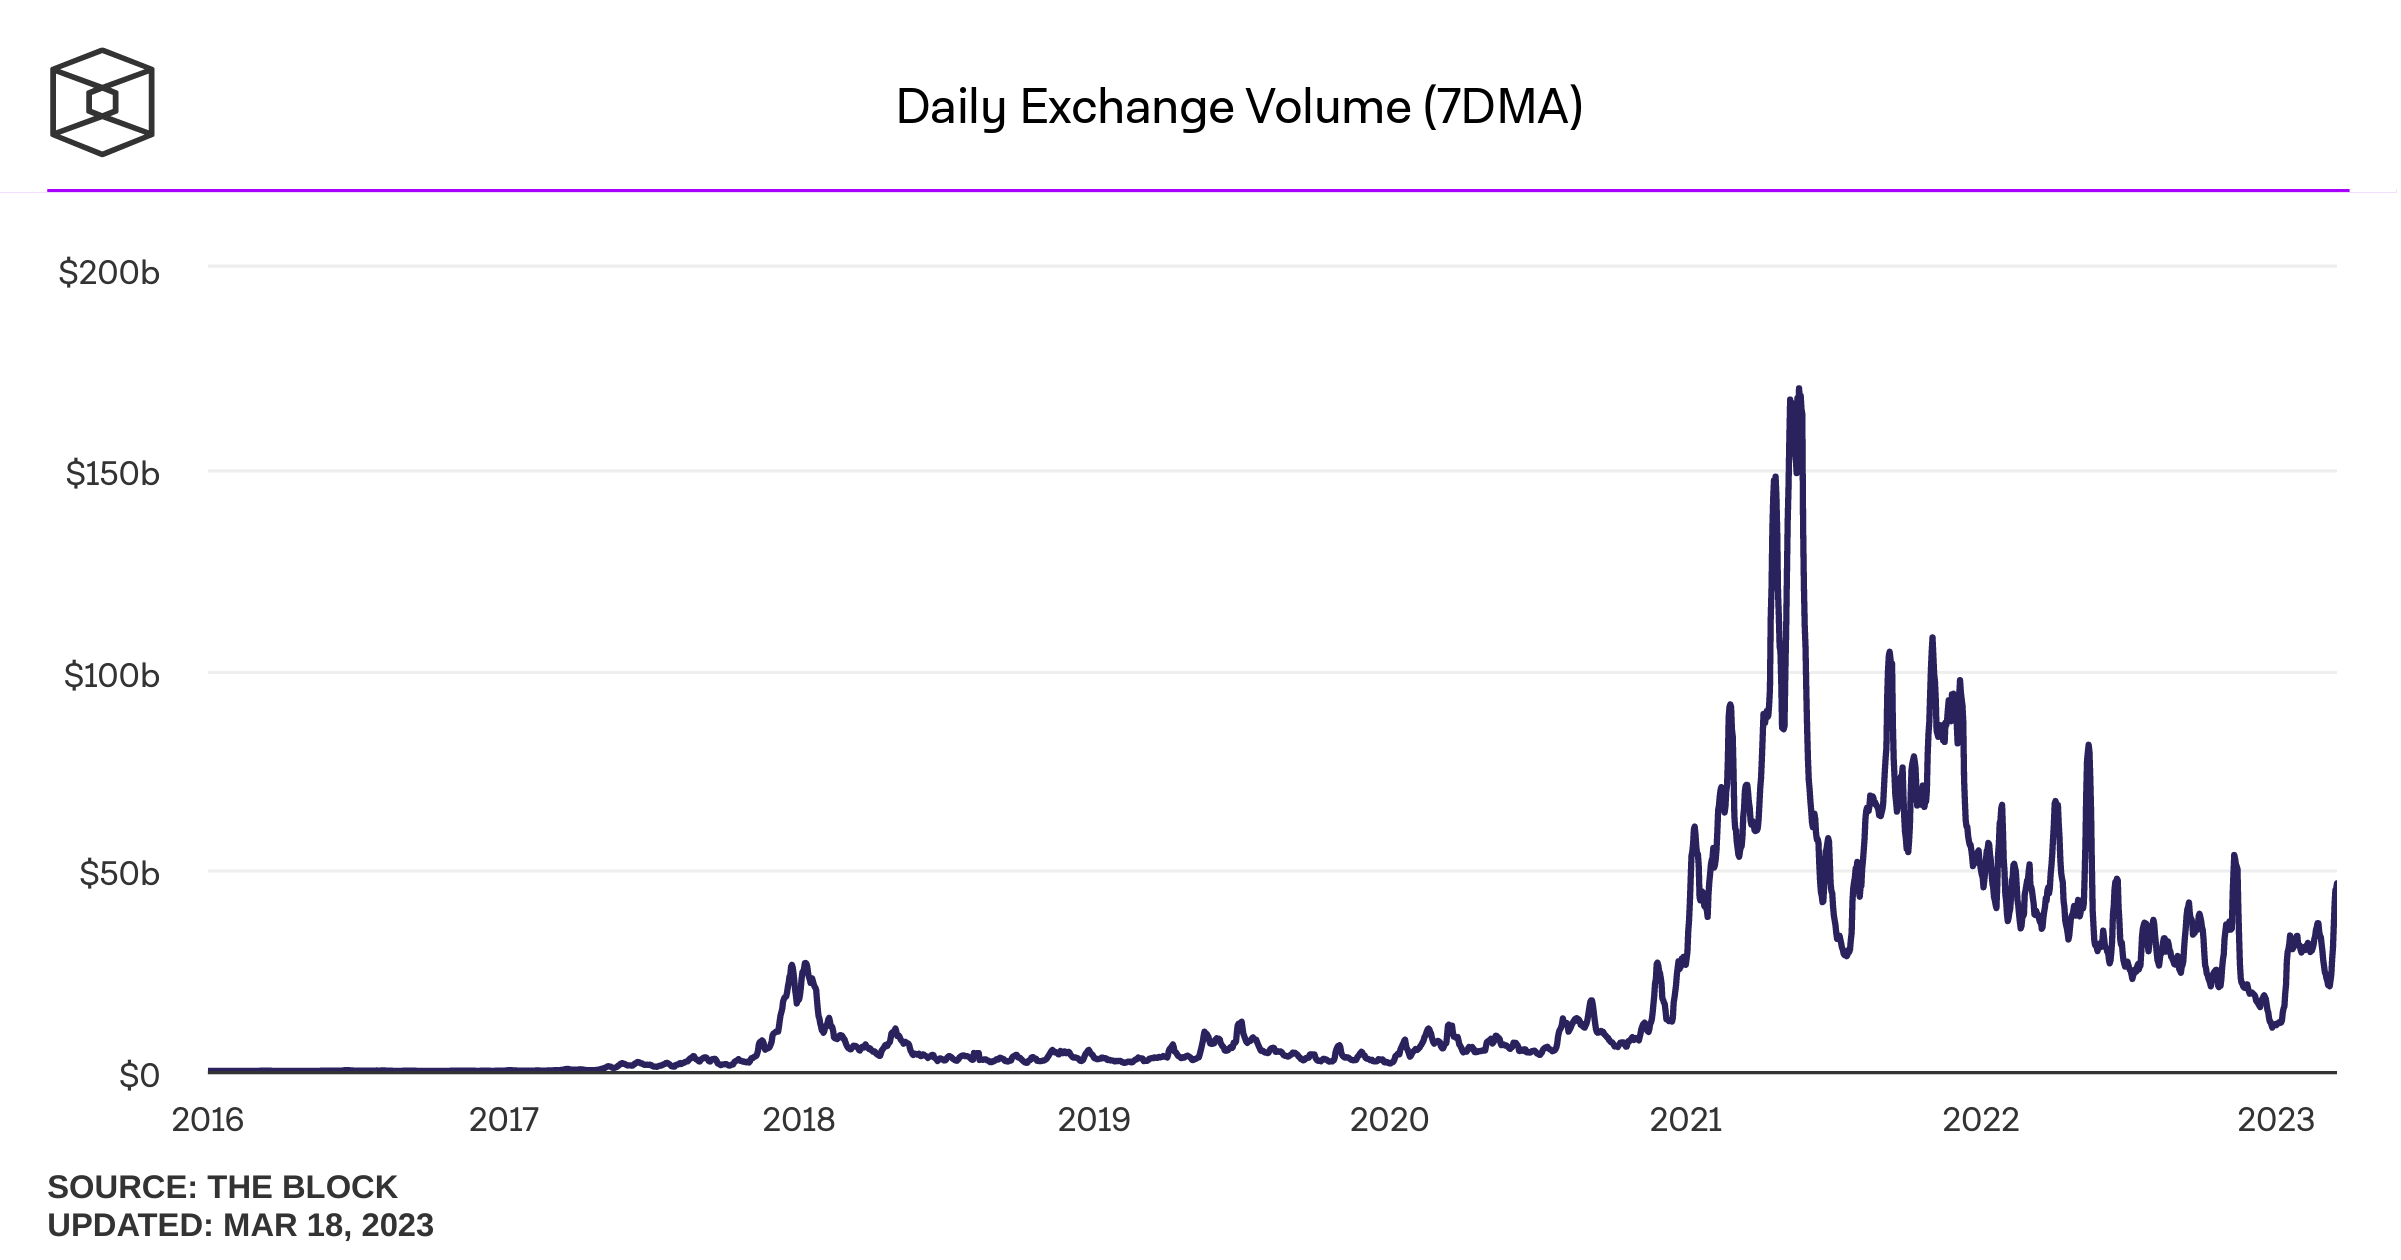
📈 7-day trading volume MA seen a significant increase, from (5B-25B) in 2017 to (50B-160B) in 2021, at 640%-1000%
In the 🇺🇸 US region, Binance's market share is less than 8%, with Coinbase leading after FTX's collapse. Other exchanges such as Kraken, LMAX, CRO, and Bifinex have also seen a piece of the pie. As the cryptocurrency market continues to grow, expect more exchanges competing to top.
BTC and ETH Spot Volume
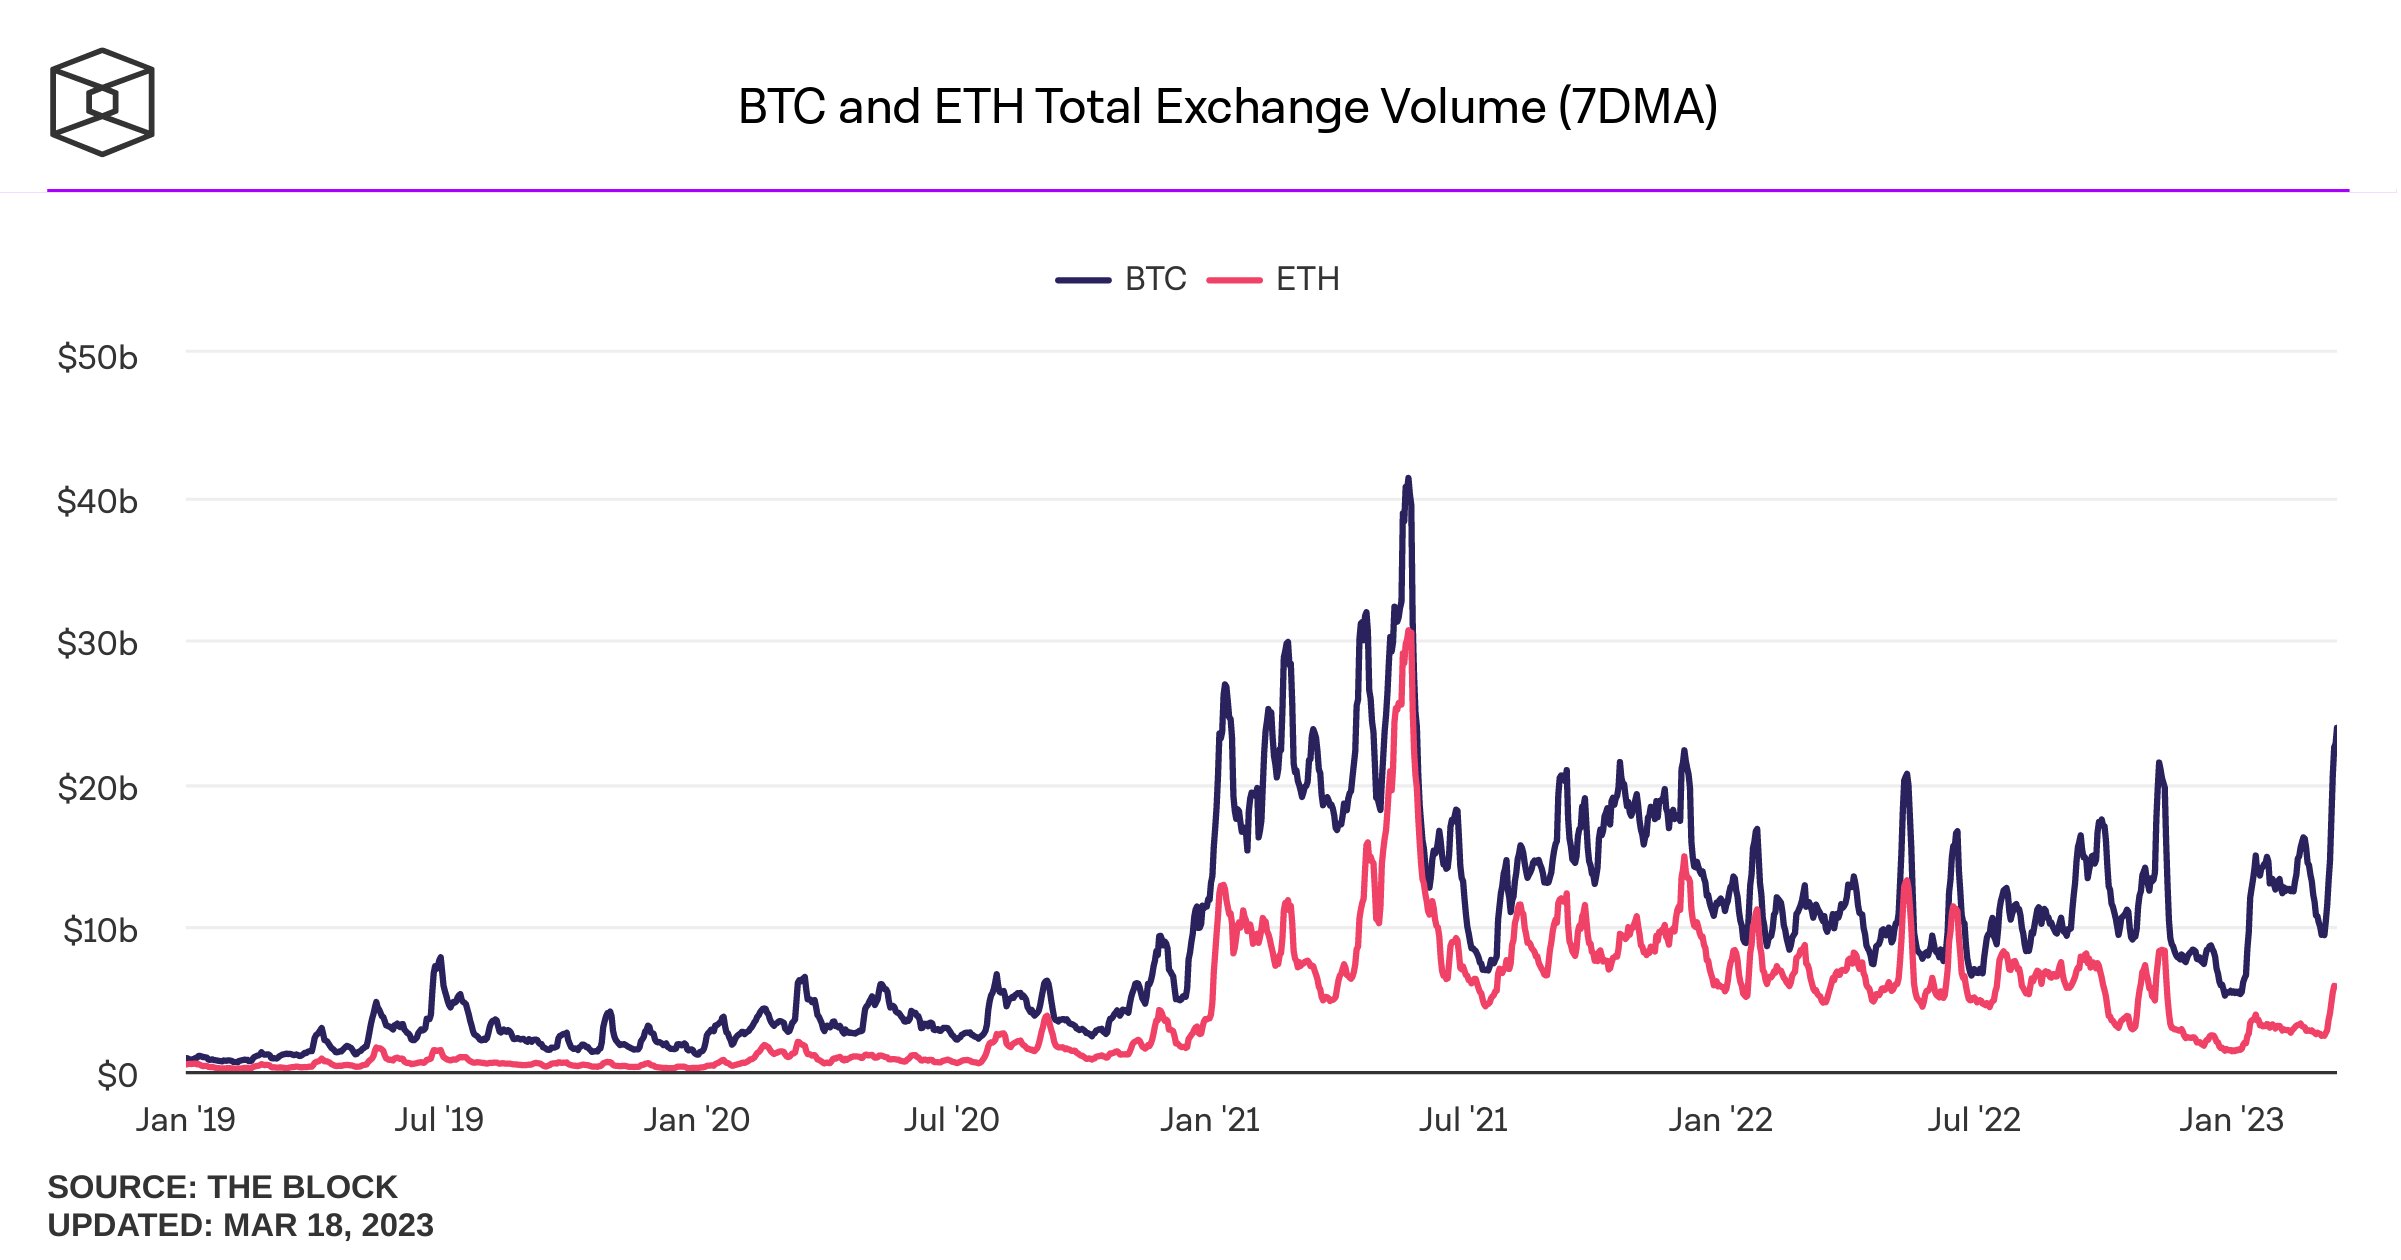
- BTC and ETH trading volumes have skyrocketed from 2.5B in late 2018 to 60B today, with a growth rate of 1200%-2400%! 🚀 The next cycle is predicted to have a growth rate of 900%-1800%, with 7-day MA trading volumes reaching up to 900B
2️⃣ Perpetual
BTC and ETH Perpetual Volume
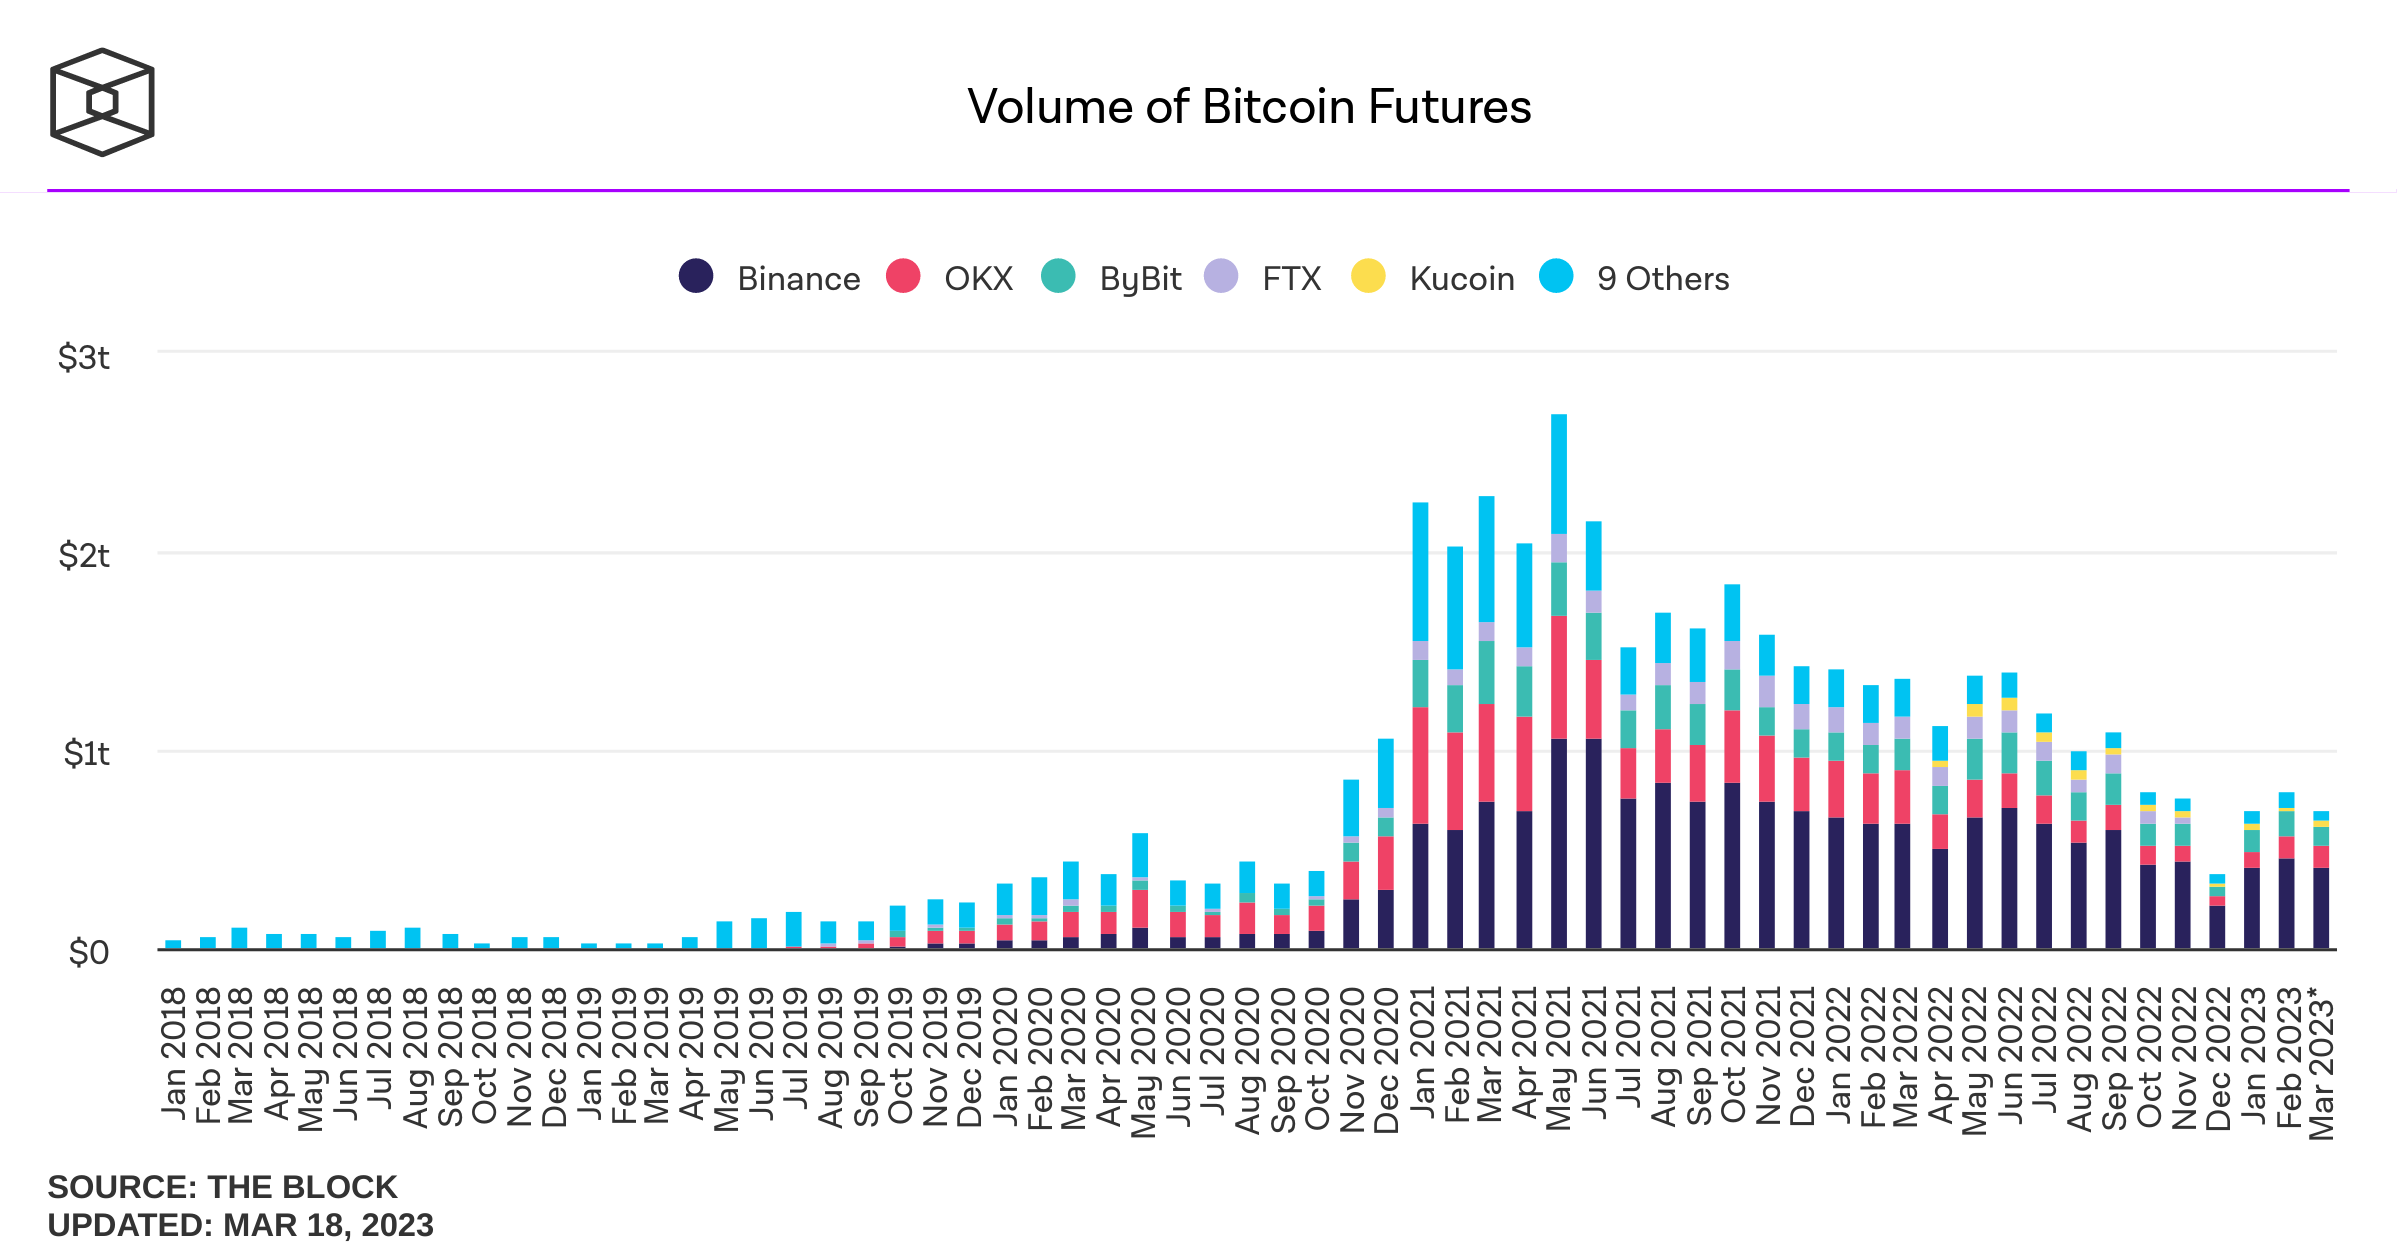
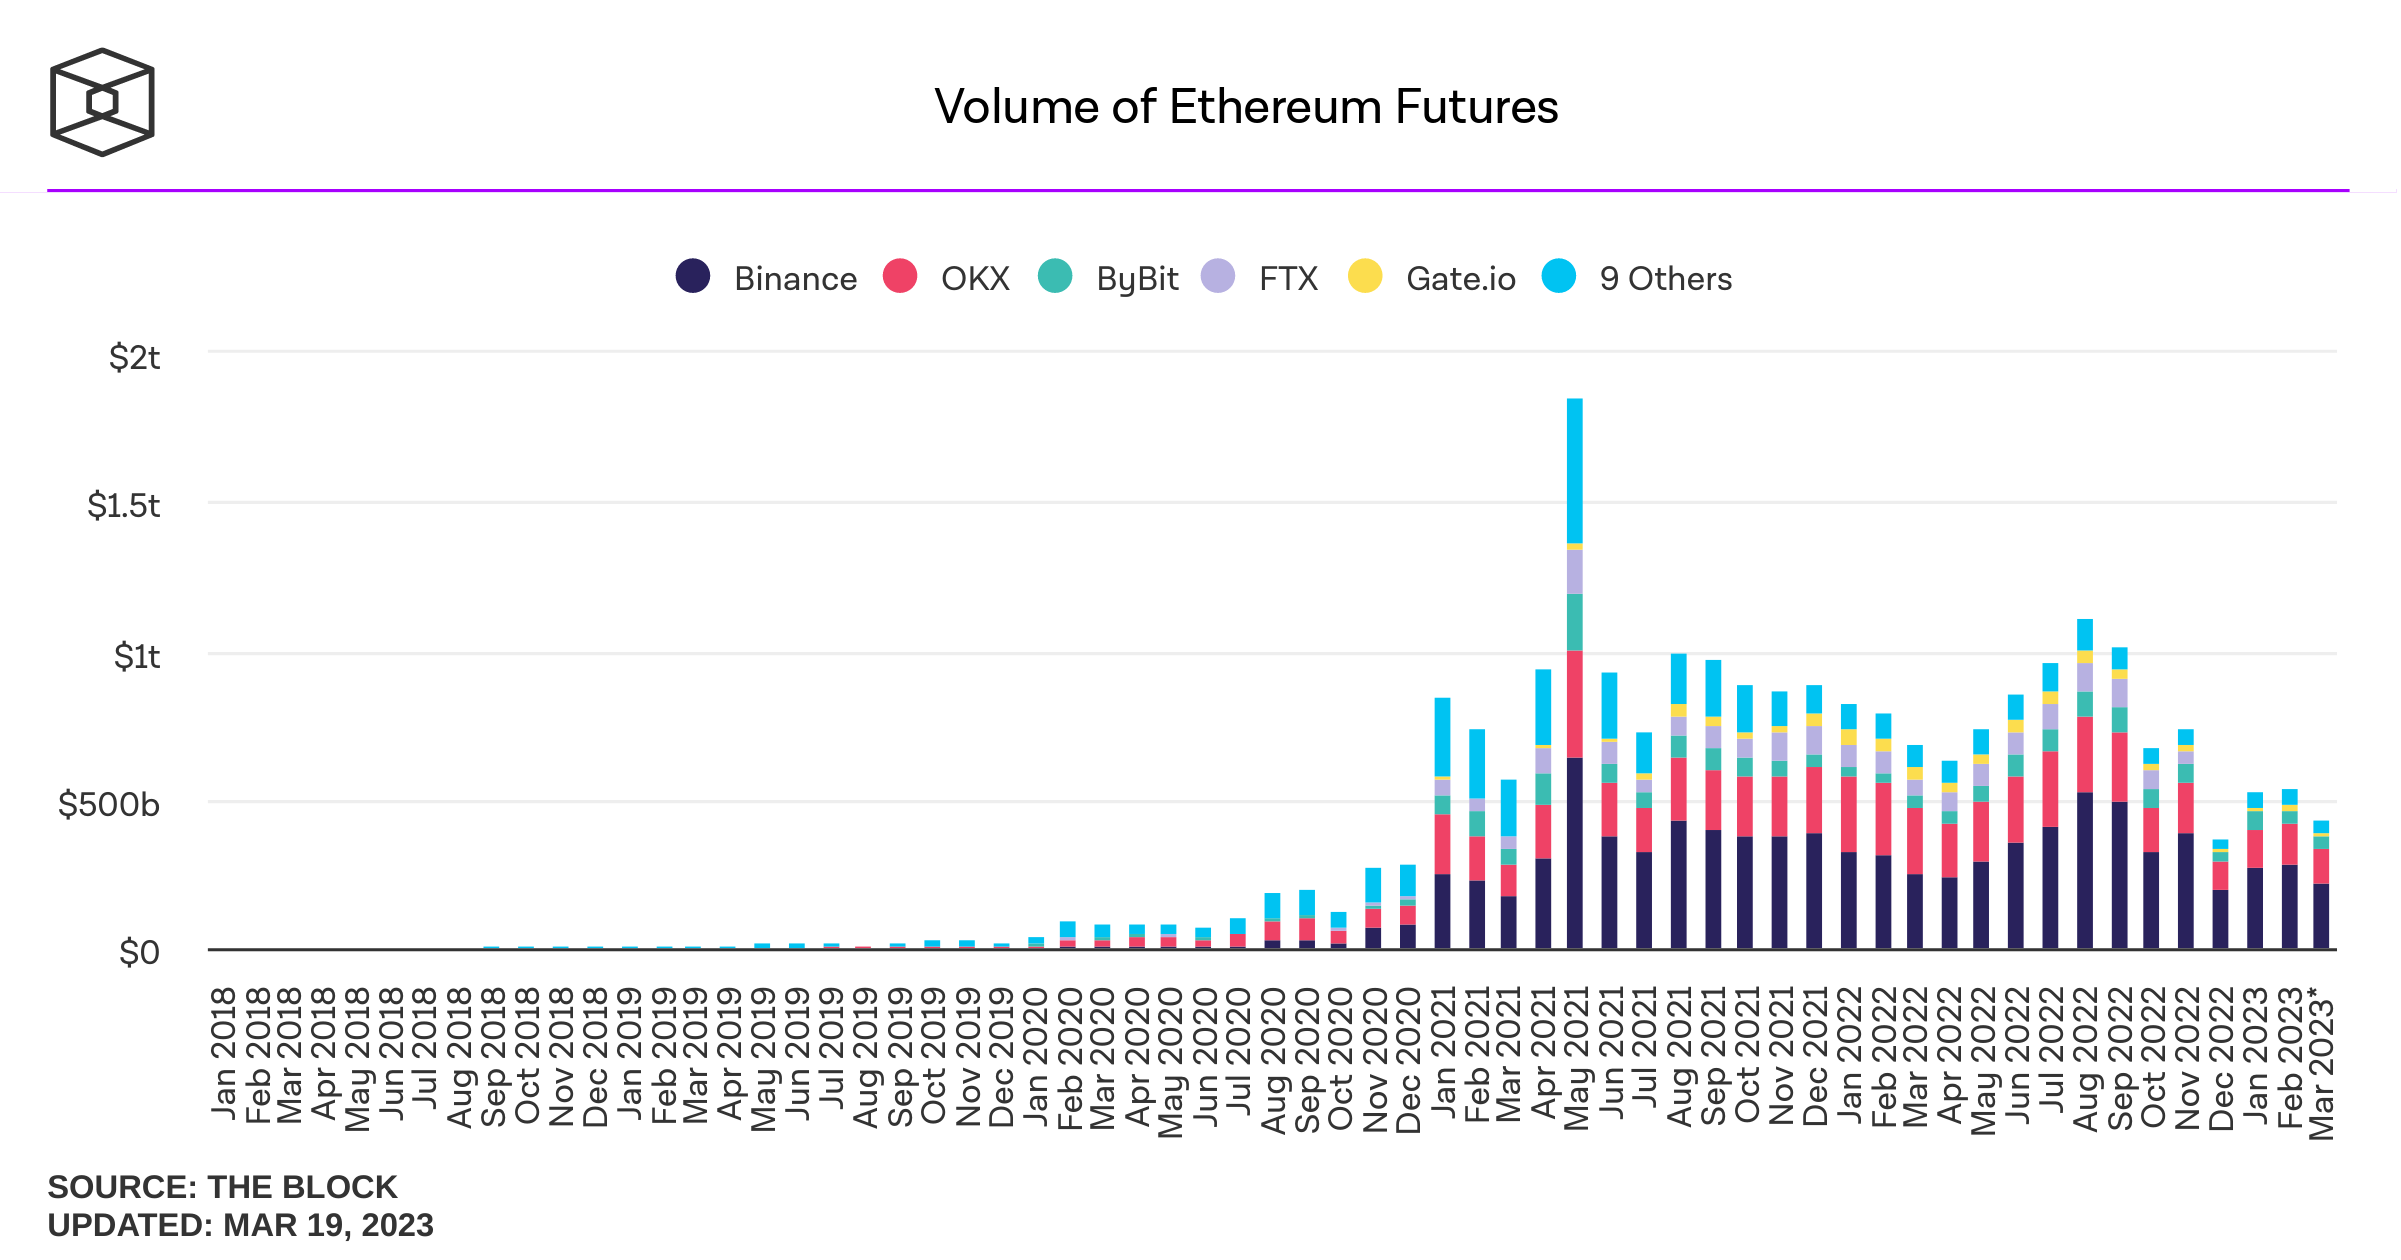
- BTC and ETH perpetual contract trading volume has surpassed all other cryptocurrencies' spot trading volume since 2018. With a monthly average trading volume of 2.5T, derivatives and margins have become the mainstream liquidity pool in the industry. #cryptocurrency #finance
Quote
⚠️ Derivatives and margin are important tools for increasing returns, but come with high risks and require strict risk management for professional traders. From 2017-2023, analyzing volatility and contract trading volume can provide insight into the crypto derivatives market.
XBT Launch & History
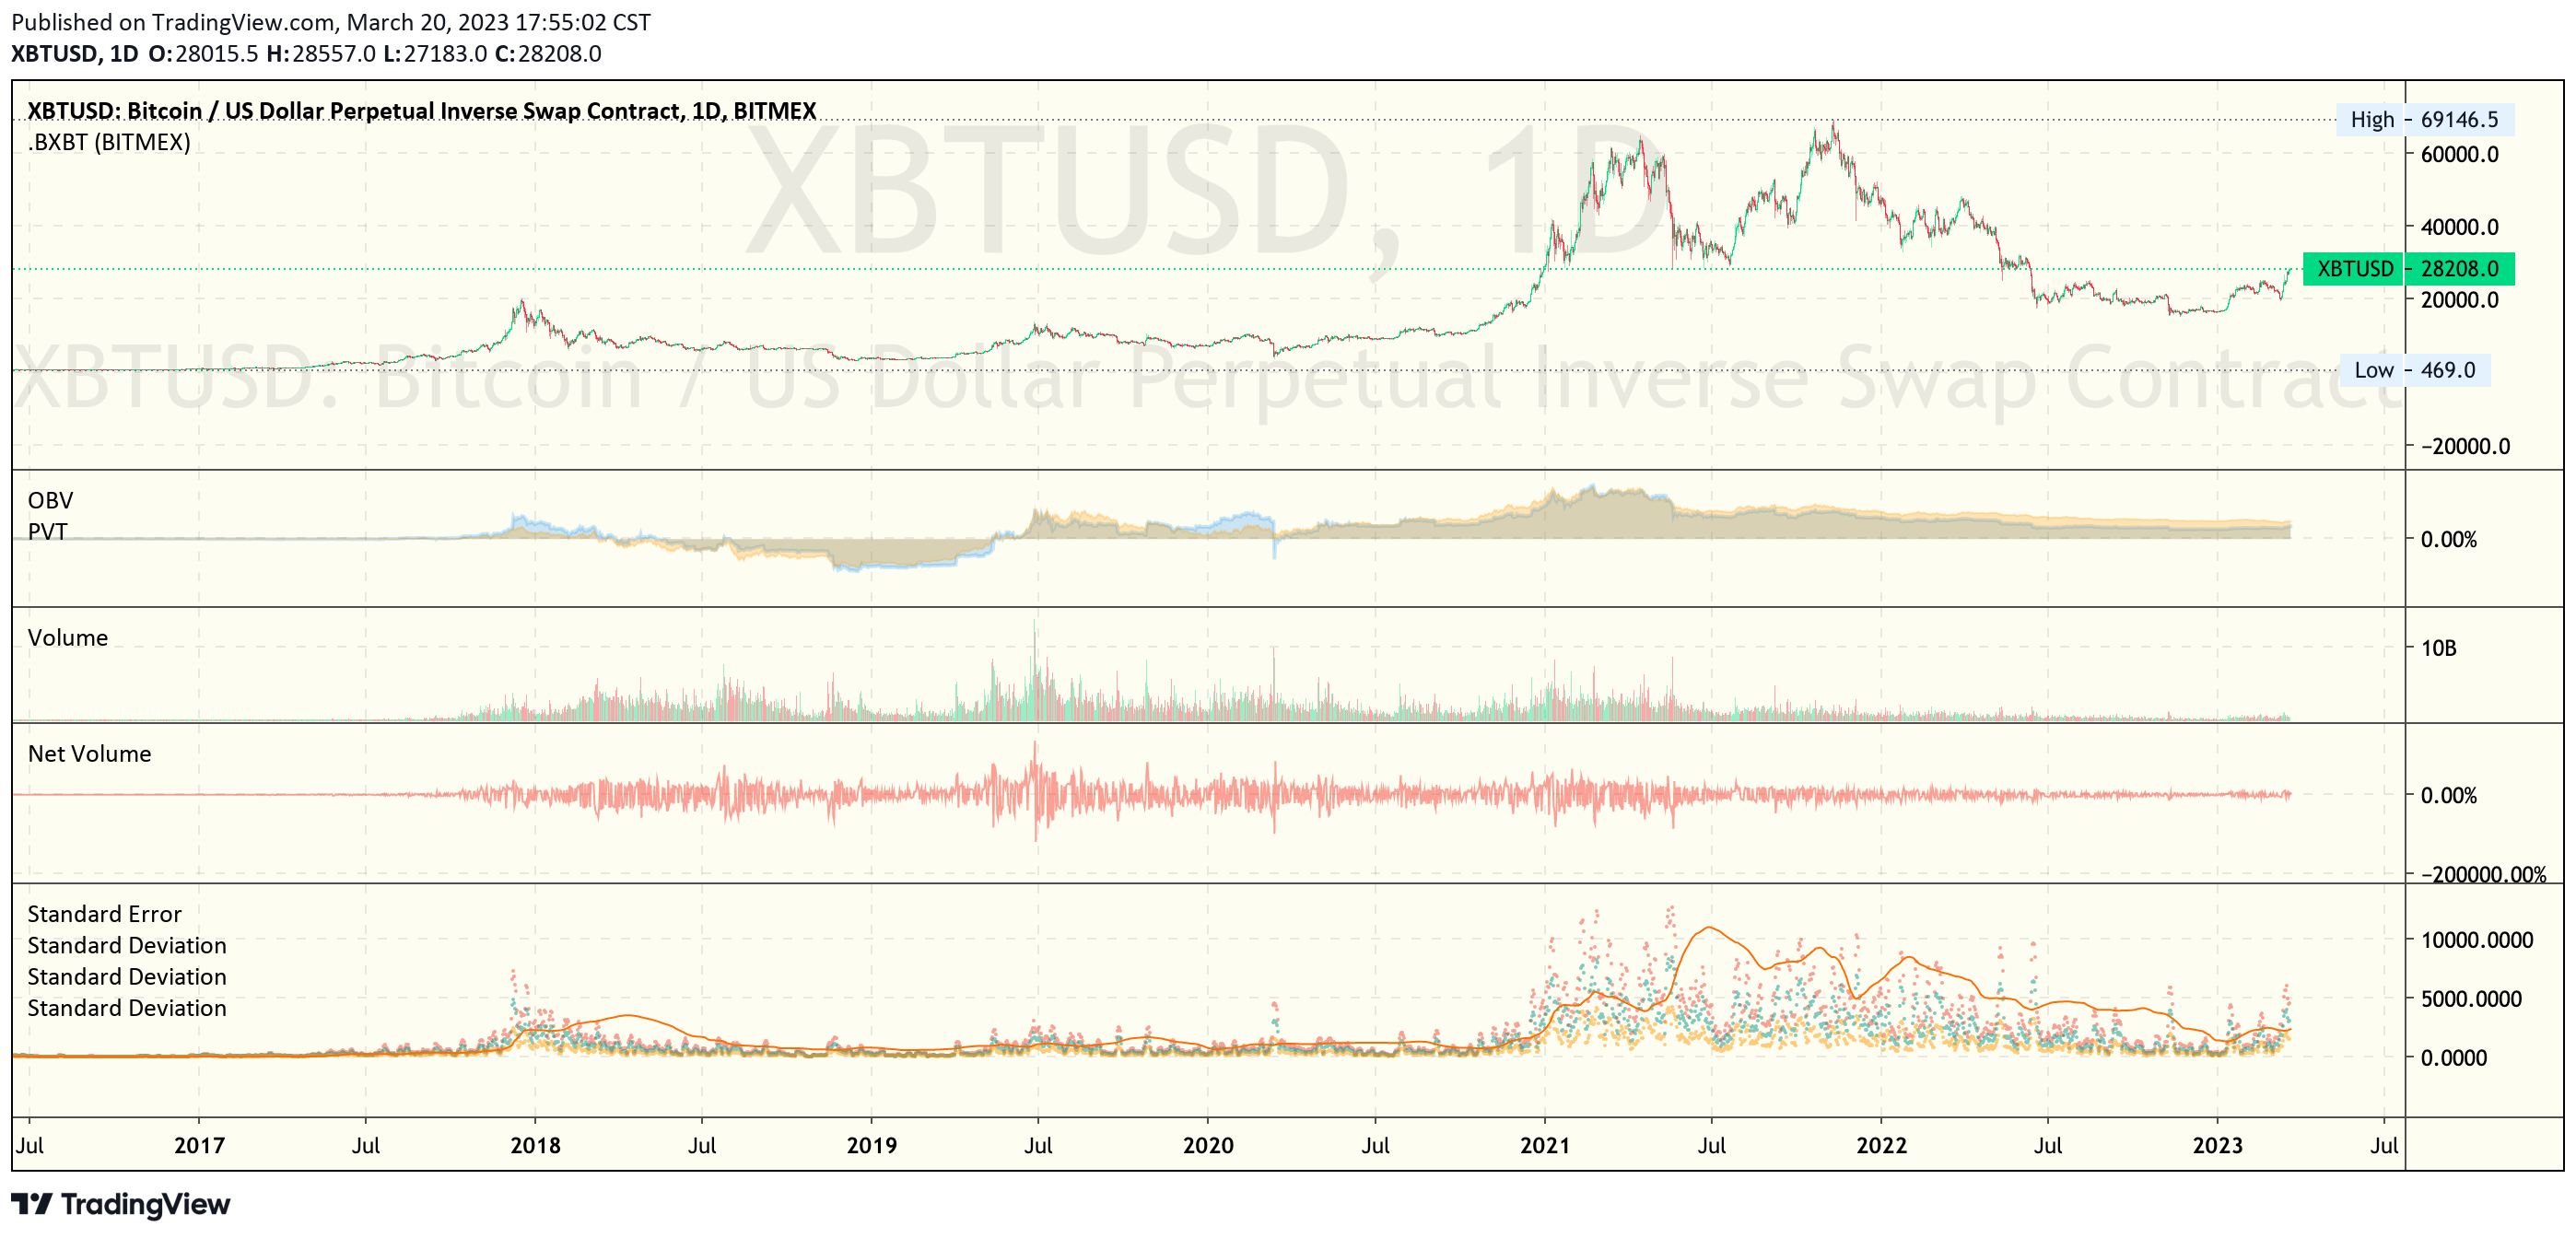
The chart depicts the historical XBT perpetual contract on Bitmex as a reference, with OBV (On Balance Volume) used to predict asset prices based on trading volume, PVT (Price Volume Trend) used to quantify the supply and demand of a certain asset. Stand.Err representing the 200 day standard error line to measure the volatility error of prices within 200 days, and 7-day 1, 2, 3Sigma represents the price fluctuation range to analyze the probability of price fluctuation within 68-95-99.7% under the normal distribution curve
2017 to 2019: Perpetual were adopted by exchanges and surpassed spot volumes. In early 2018, there was an imbalance in PVT/OBV supply for longs over shorts, leading to deviation from the 200-day error line and 95-99.7 percentile black swan events.
In 2019, there was an imbalance in PVT/OBV supply for shorts over longs, leading to multiple black swan events deviating from the 200-day error line near the beginning of the year with a 1 sigma signature exceeding the error line.
2020 to 2021: a severe black swan event occurred due to the pandemic, causing a huge imbalance in perpetual PVT/OBV. Residual analysis has not been conducted yet, but it appears to have an error rate as high as 200%.
In early 2021, QE led to overheating of risk assets, but professional investors and more mature derivative tools emerged to prevent frequent deviations from error lines and black swan events. However, the balance between perpetual PVT/OBV was about to tilt. 2021 May 19th, the China Ban occurred, causing a deviation between error lines and Sigmas, and a sharp drop in trading volume.
2022 to Now: the industry faced de-leveraging due to QT, resulting in a PVT/OBV balance tilt towards short positions. Although 3Sigma and 2Sigma experienced black swan events, there were no severe deviations in the 1Sigma probability as in 2017.
📌 Summary
In summary, volatility returns have decreased due to professional derivative trading and mature hedging tools. 1Sigma has not experienced severe deviation probability events as in 2017. Therefore, volatility returns are more evenly distributed among professional traders.
3️⃣ Options
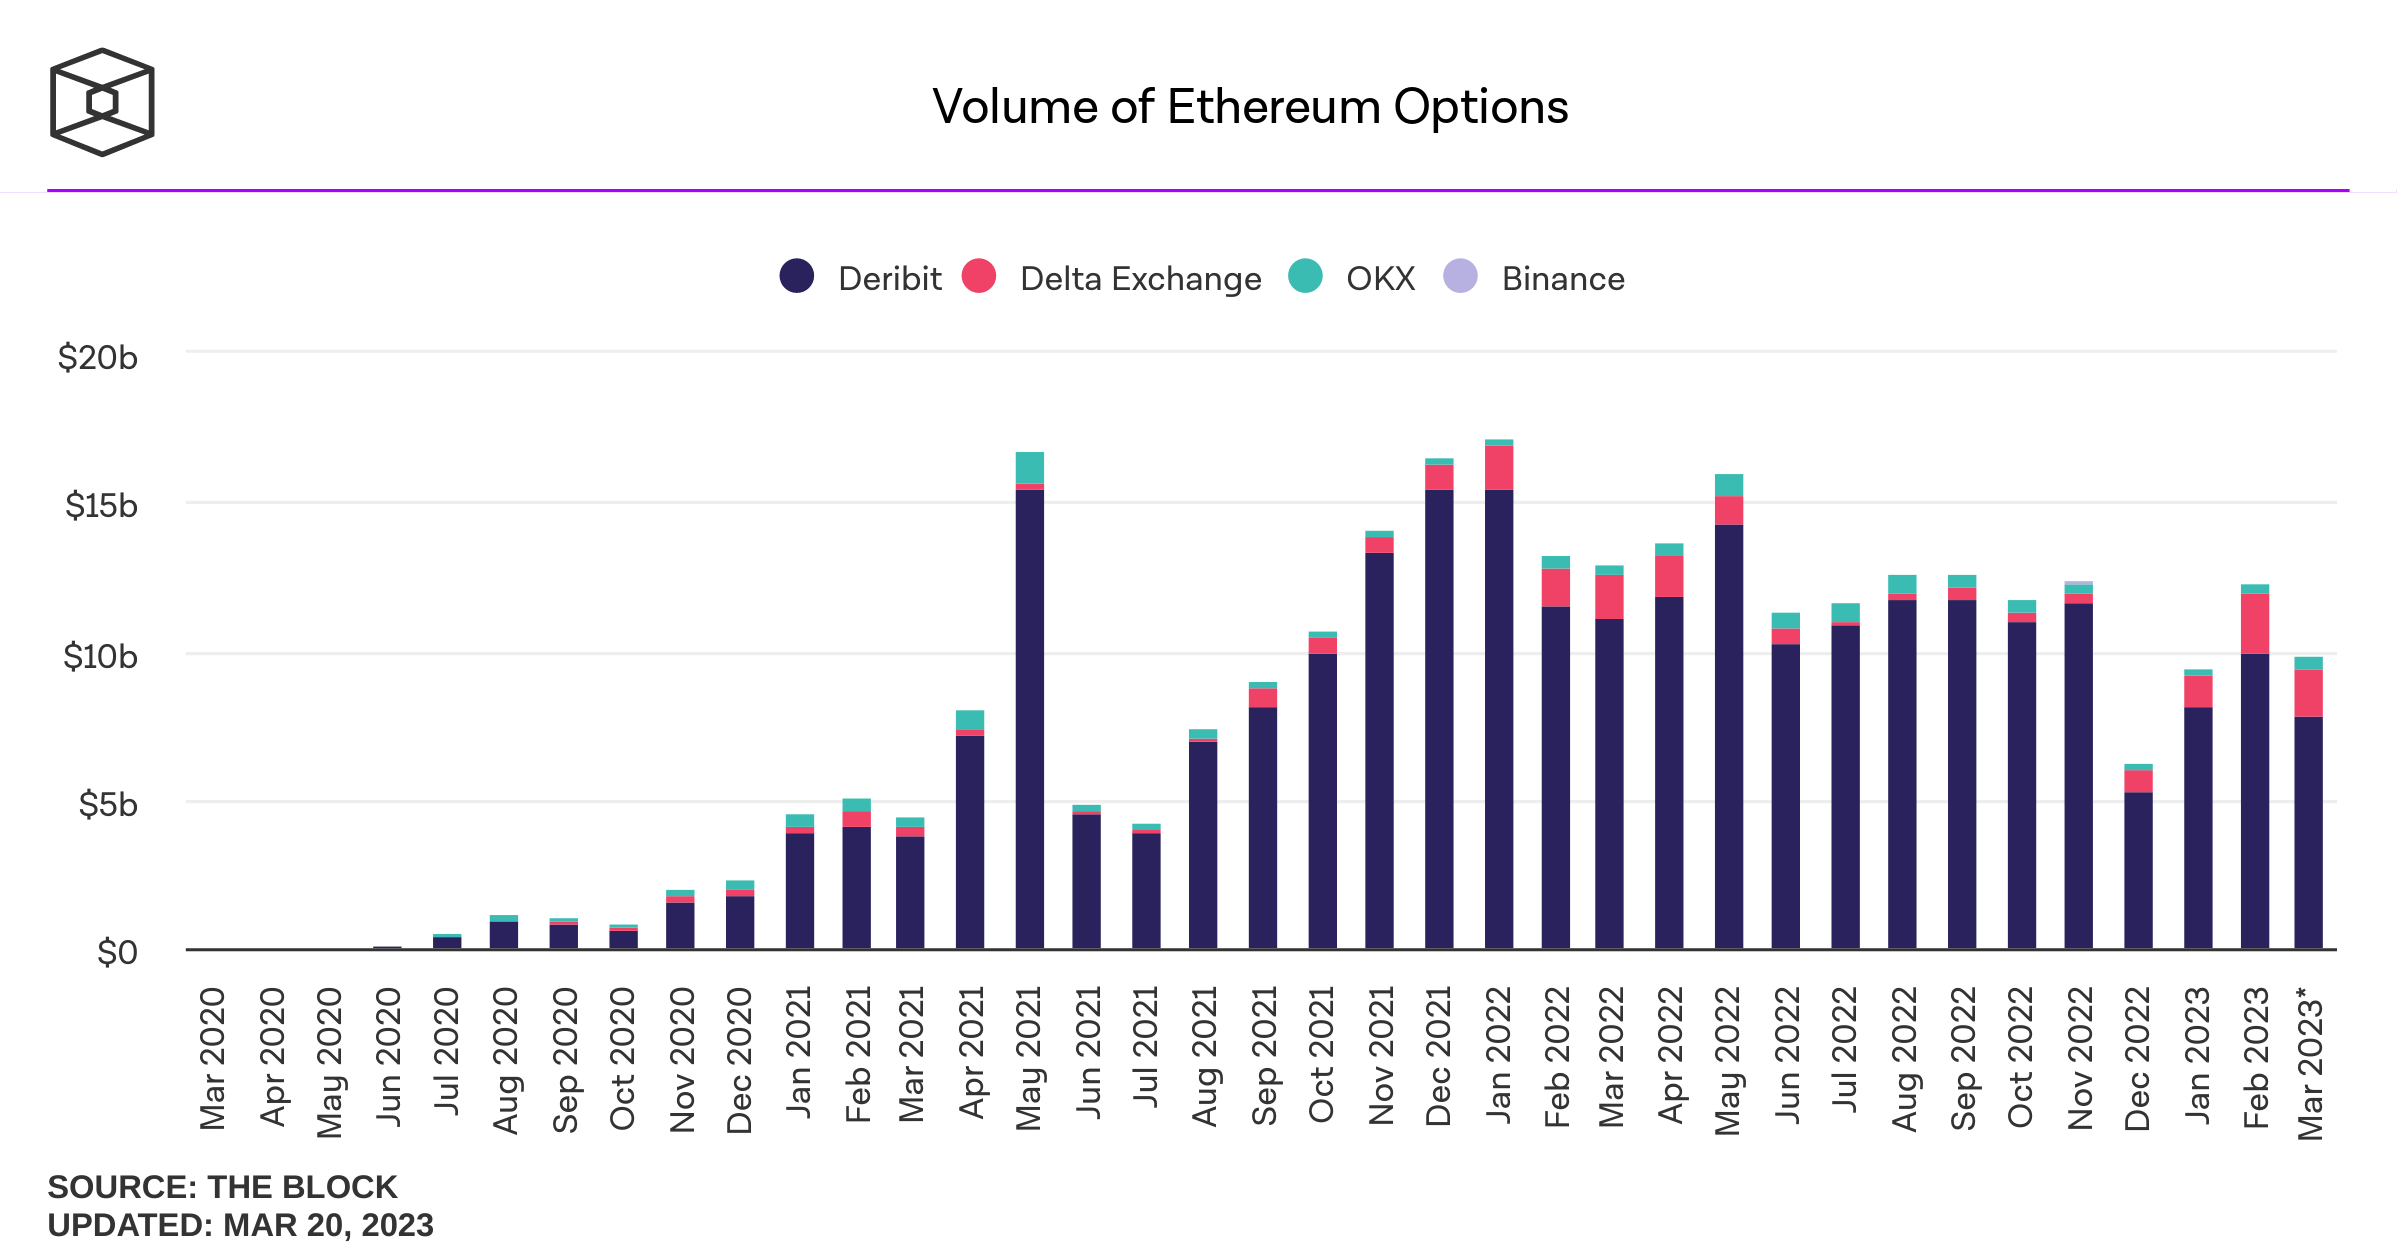
BTC/ETH options Volume
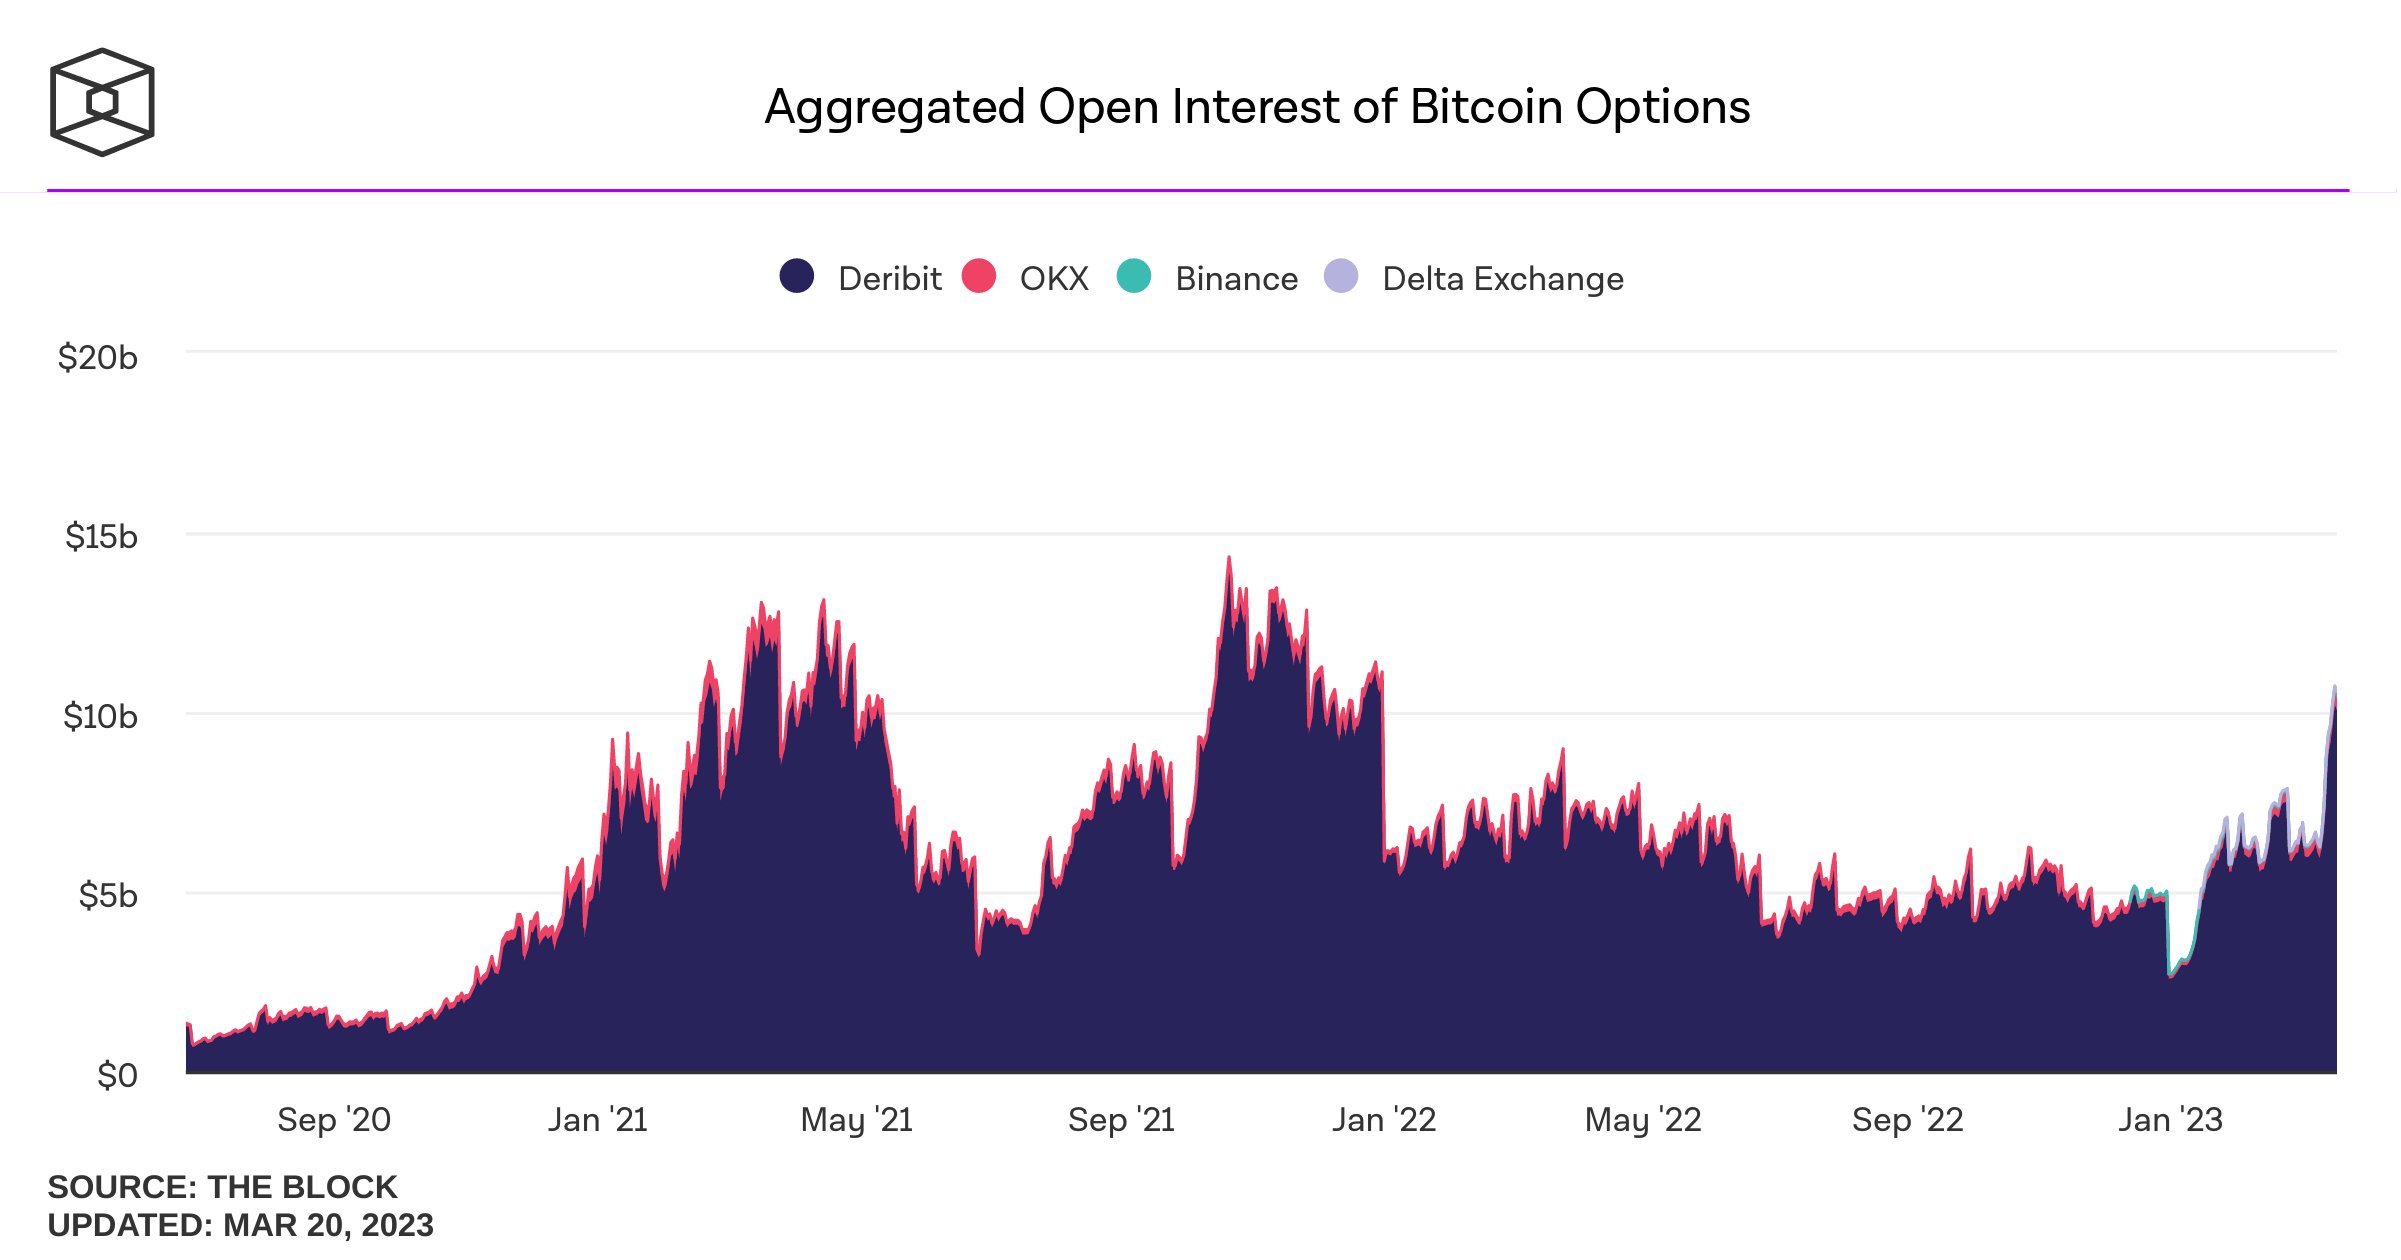
BTC/ETH options Open Interests

📌 Summary
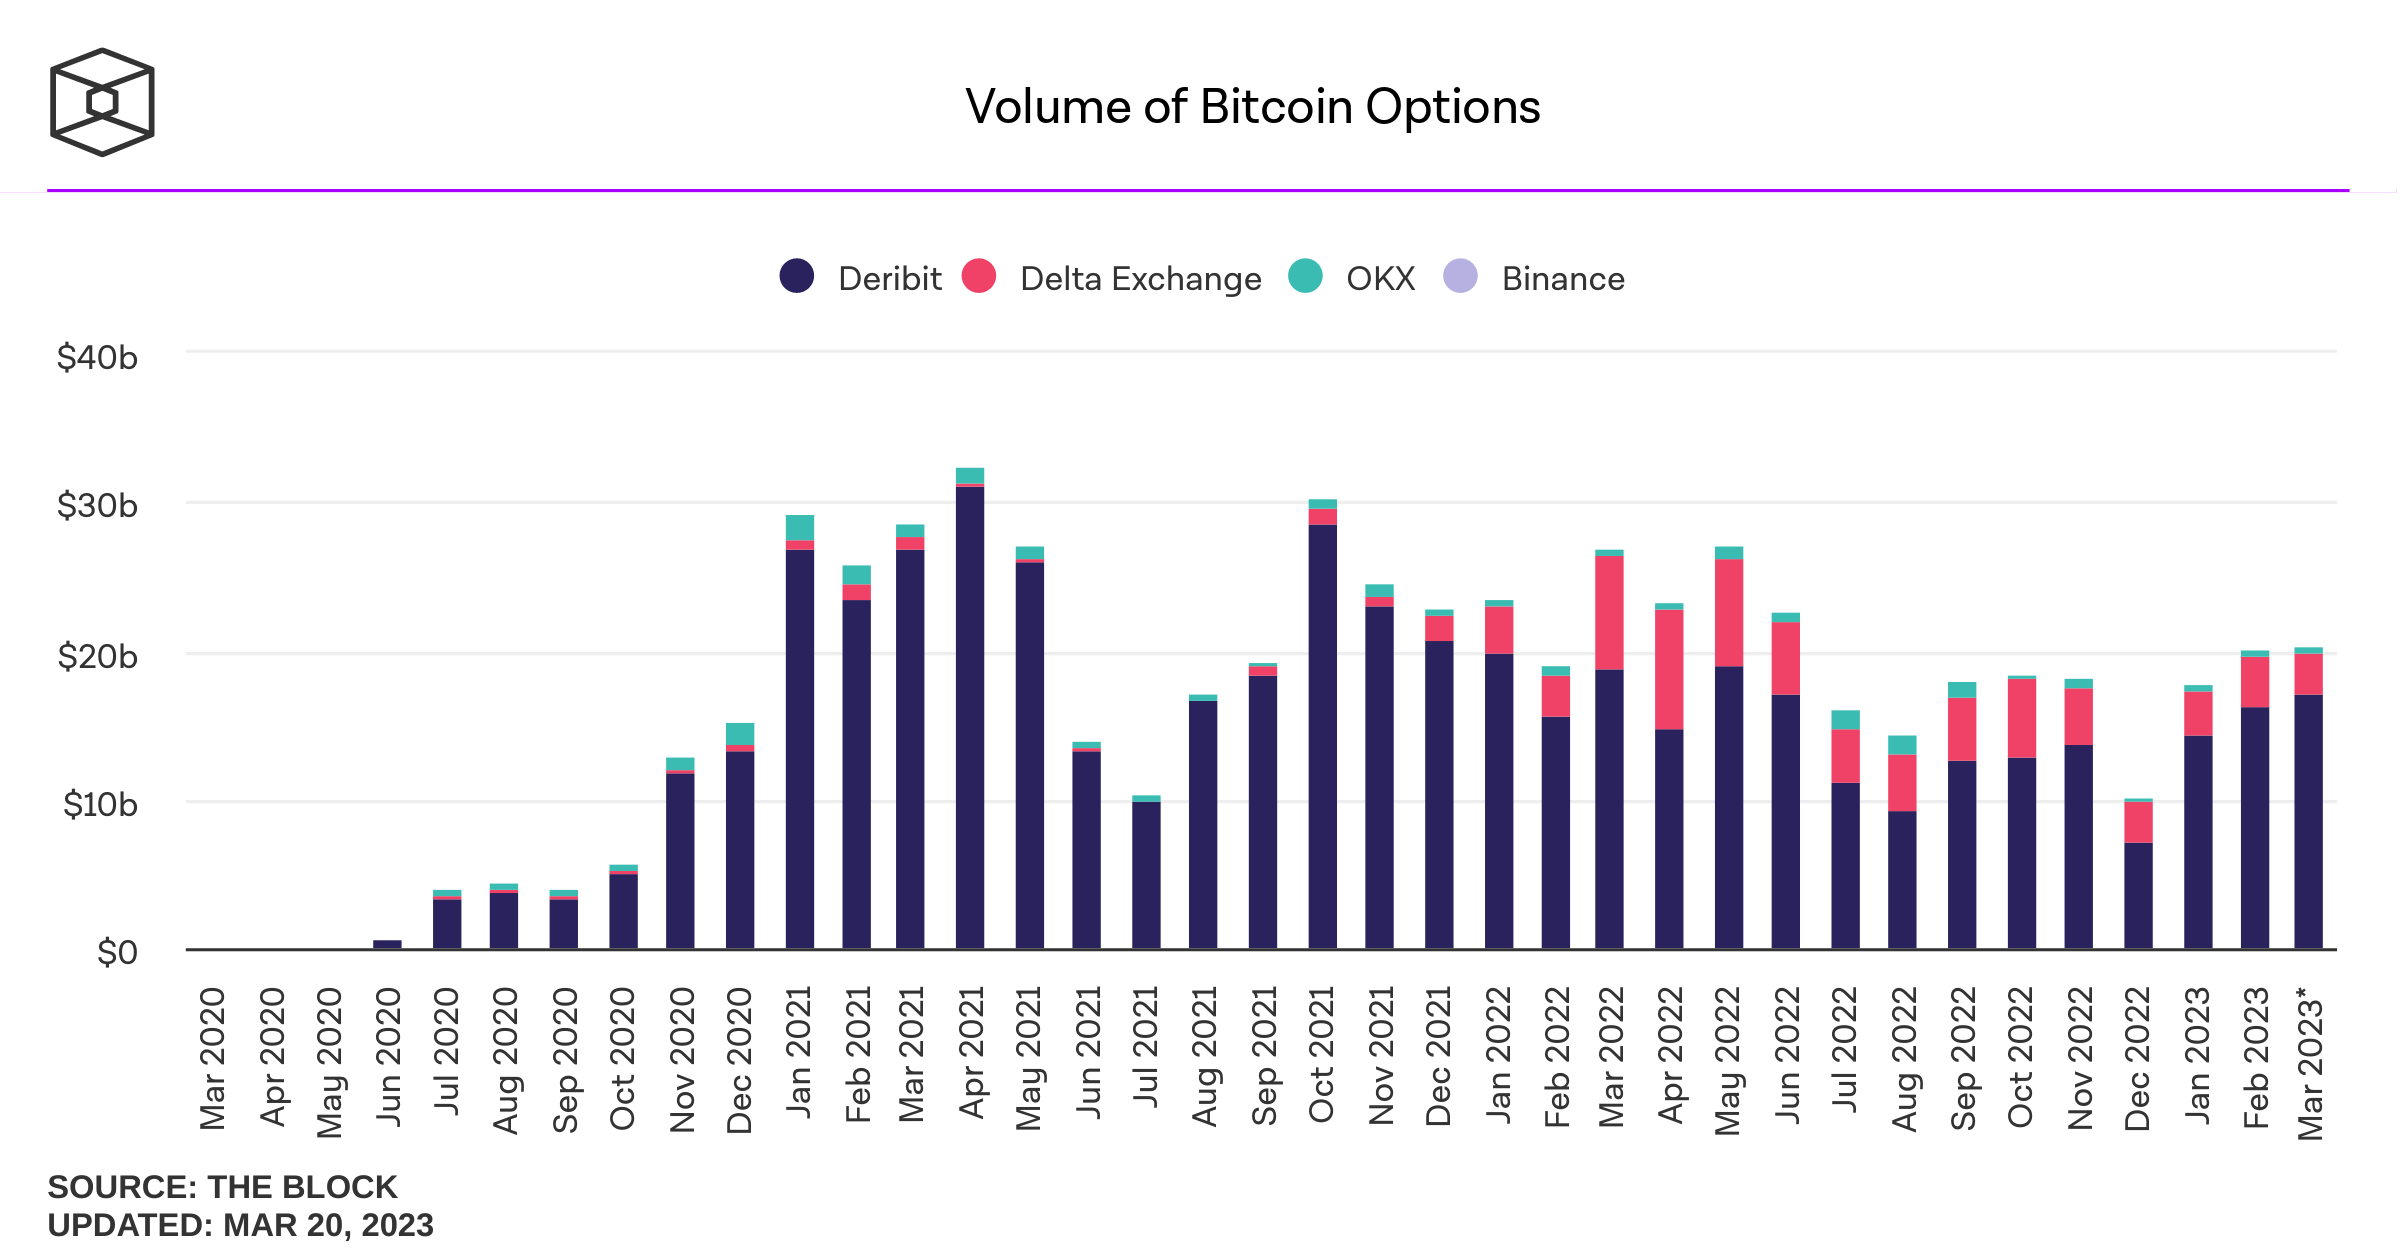
- Deribit launched its options trading platform in 2020 and quickly gained a large market share. OKX followed with an internal retail options market, which only captured 1%-5%. In 2021, Delta Exchange captured a market share of 10%-15%.
- The BTC+ETH options trading market had a monthly trading volume of up to 45B during the 2020-2021 bull market, generating 13M monthly revenue with a 0.03% maker-taker fee rate. The highest position borrowing fee rate was 22.5B.
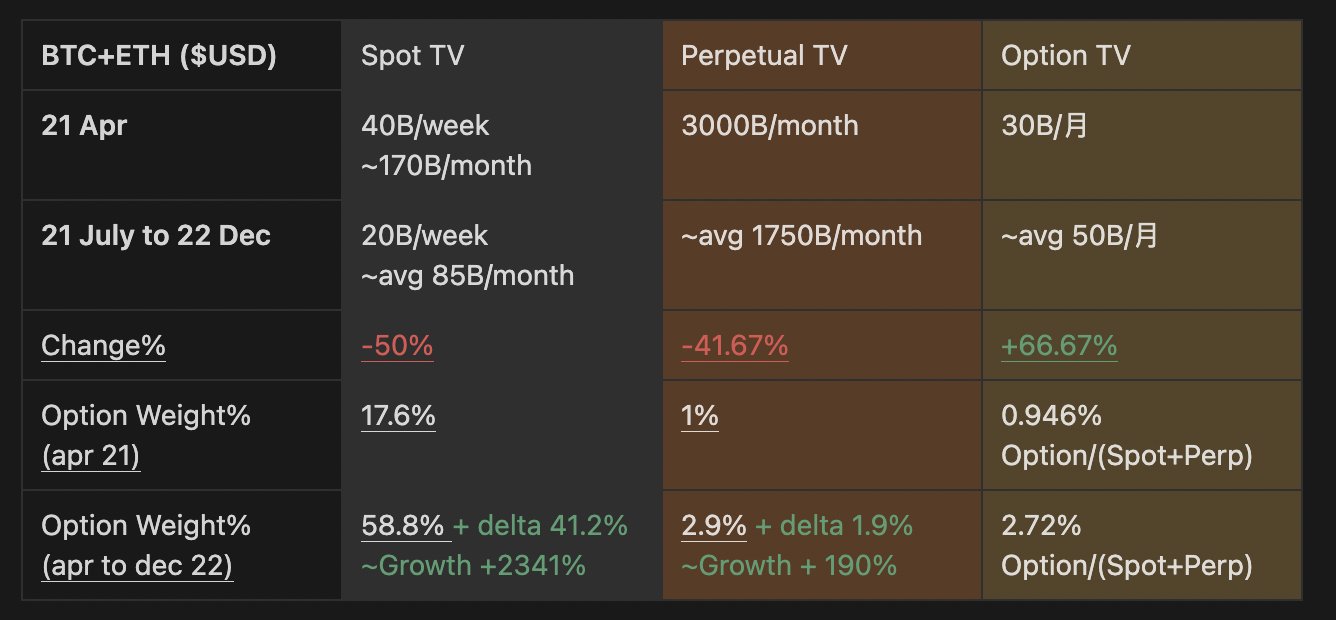
- Compared to the decline in trading volume of spot/perpetual contracts in 2021-2022, the trading volume of options has recovered to the high point of the bull market in Q1 2023 and maintained strong trading volume. Compared to the 50% decline in spot trading volume from the bull market to the end of 2022 and the 41.67% decline in perpetual contract trading, the trading volume of options has increased by 66.67%. Assuming investors hedge their spot or contract positions 100% with options, (spot or contract trading volume) / (options trading volume) can intuitively indicate the trend of market hedging or use of hedging tools. From the following data table, it can be seen that:
- Spot Trading Volume hedging options +2341% from 17.6% to 58.8% from the bull market to EOY2022.
- Perpetual Trading Volume hedging options +190% from 1% to 2.9% from the bull market to EOY2022.
- The growth of the BTC+ETH options trading market facilitated the expansion of derivative hedging markets.
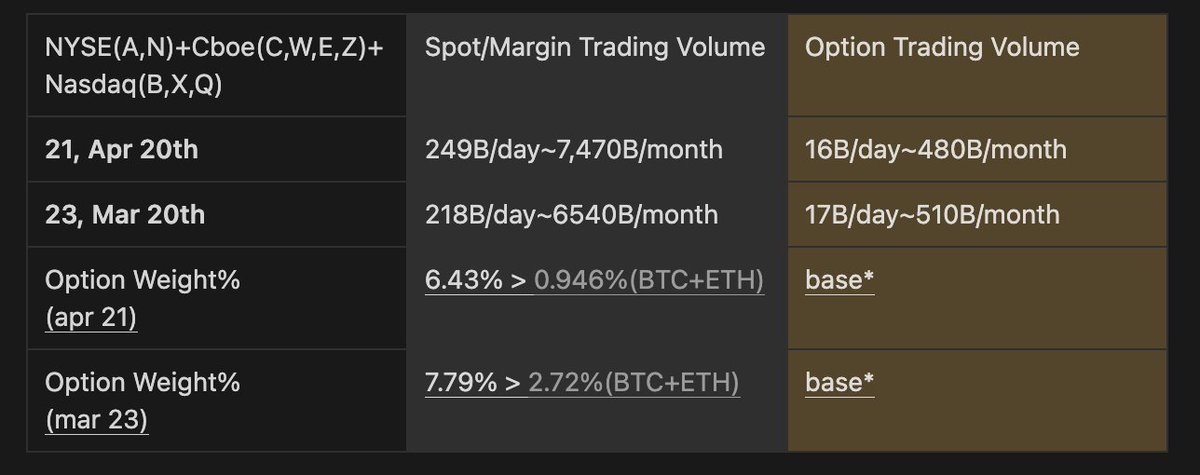
🆚 Options Tradable Nasdaq
Looking at traditional Nasdaq's spot + margin trading volume, options have a much higher hedging level than cryptocurrencies and are more mature:
April 2021, Nasdaq's spot (assets tradable with options) had a monthly trading volume of 7470B, while BTC+ETH spot had a monthly trading volume of 170B, a difference of 44 times.
April 2021, Nasdaq's spot (assets tradable with options) had a derivative trading volume of 480B, while BTC+ETH derivatives had a monthly trading volume of 30B, a difference of 16 times.
April 2021, the proportion of derivative spot trading of Nasdaq's spot (assets tradable with options) was 6.43%, while BTC+ETH derivative spot trading was 0.946%, a difference of 6.79 times.
The year-on-year multiples of the above ratios in early 2023 and late 2022 are approximately 77 times, 10 times, and 2.86 times, respectively.